A milestone chart is a powerful project management tool that builds upon the foundation of traditional bar charts, specifically Gantt charts, by emphasizing key events or stages within a project timeline. This focus makes milestone charts an invaluable tool for project managers who need to keep track of significant phases and ensure that projects stay on schedule. Let’s explore how milestone charts represent an improved version of bar charts, and why they are preferred for certain aspects of project management.
Table of Contents
How Milestone Charts Improve Upon Bar Charts
- Emphasis on Key Events: Traditional bar charts, such as Gantt charts, provide a detailed view of all project activities, showcasing the start and end dates for each task. While this level of detail can be helpful, it can also be overwhelming, especially in complex projects with numerous tasks. Milestone charts, on the other hand, highlight critical points or deliverables within the project. By focusing only on these key events, milestone charts help project managers and stakeholders track progress against important benchmarks. This makes it easier to ensure that the project is on schedule for these crucial points, thereby reducing the risk of overlooking critical phases amidst a sea of detailed task information.
- Improved Clarity and Communication: Milestone charts provide a simplified and clear visualization of project progress, focusing on the essential checkpoints. This clarity is beneficial for both project managers and stakeholders, as it allows for quick assessments of the project’s status without delving into the minutiae of every task. In meetings or reports, milestone charts can effectively communicate the project’s overall progress, enabling quicker and more efficient decision-making. This is particularly valuable in situations where stakeholders are not deeply involved in day-to-day operations but need to be informed about the project’s key achievements and upcoming challenges.
- Enhanced Project Tracking: By focusing on milestones, project managers can set clear, attainable goals for their teams. Each milestone acts as a mini-deadline within the broader project timeline, providing teams with specific targets to work towards. This structured approach helps in maintaining momentum and ensures that the project progresses steadily towards completion. Tracking milestones can also facilitate the identification of potential delays or issues early in the project lifecycle, allowing for timely interventions and course corrections.
- Motivation and Morale: Recognizing the achievement of milestones can boost team morale. When project teams see tangible evidence of progress—such as the completion of a milestone—they are more likely to feel a sense of accomplishment and motivation. This positive reinforcement can be crucial for maintaining high levels of productivity and enthusiasm, particularly in long-term projects where the end goal may seem distant.
Example Scenario: Construction Project
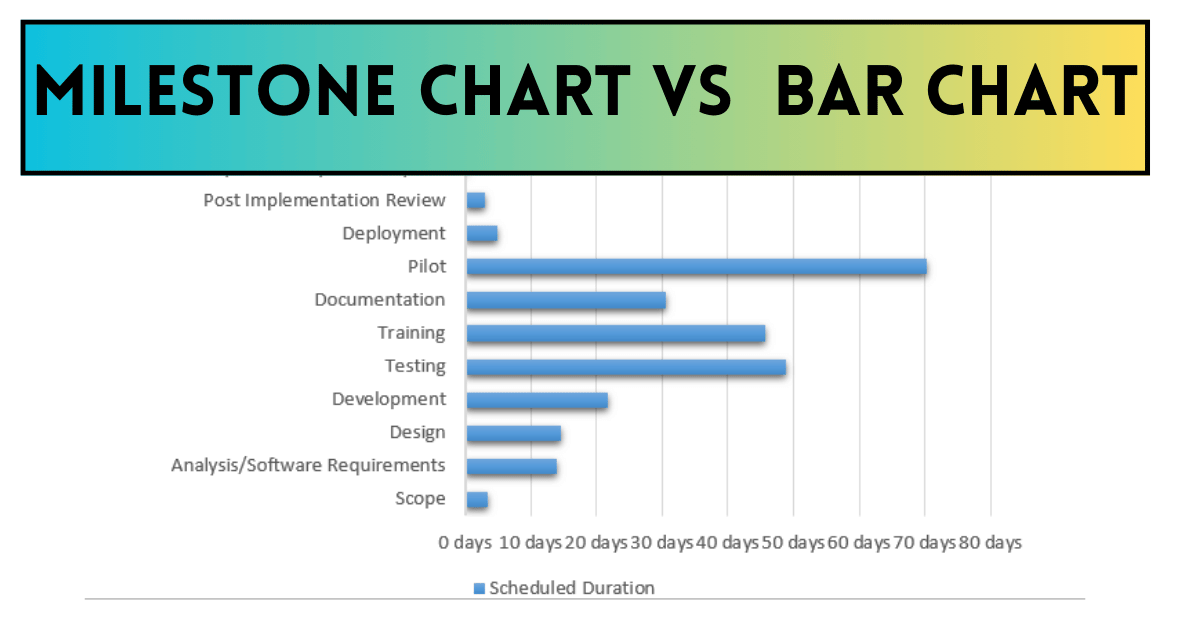
Consider a construction project, which is often complex, involving numerous tasks such as site preparation, foundation laying, framing, roofing, and interior finishing. A bar chart might display each of these activities with their respective timelines, offering a comprehensive view of the entire project. However, this detailed information can be cumbersome to interpret, particularly for stakeholders who are more concerned with the overall project status rather than the specifics of each task.
A milestone chart in this context would instead highlight key events such as “Foundation Completed,” “Structure Topped Out,” “Roof Installed,” and “Project Handover.” These milestones represent significant achievements that are crucial to the project’s success. By focusing on these points, project managers can easily track whether the project is progressing as planned, make timely decisions, and communicate effectively with stakeholders. Milestone charts thus provide a high-level view of the project’s progress, making them an essential tool for managing complex projects.
Conclusion
Milestone charts improve upon traditional bar charts by offering a streamlined, high-level view of project progress, focusing on key events that are crucial for project success. They enhance clarity, facilitate better communication, and enable more effective project tracking. By emphasizing the achievement of significant goals, milestone charts help keep projects on track, maintain team motivation, and ensure that stakeholders remain informed about the project’s status. This makes milestone charts an indispensable tool in the toolkit of any project manager.
All Questions Related to Bar Chart/Gantt Chart in Project Management
Why is a milestone chart better than a bar chart?
Milestone charts excel in tracking project progress by focusing on key events and significant dates, whereas bar charts display task durations. This makes milestone charts better for highlighting critical achievements and deadlines, enhancing clarity and communication.
What is an example of a milestone chart?
An example is the timeline for building a new structure, with milestones like “Foundation Completion,” “Framing Complete,” and “Roof Installation.” Each milestone marks crucial phases in the construction process.
What is a milestone bar chart?
A milestone bar chart combines bar charts and milestone charts, showing task durations with bars and marking key events or achievements along the timeline, providing a comprehensive view of both progress and significant points.
What is an example of a milestone in a Gantt chart?
In a Gantt chart for software development, an example would be “Beta Version Release,” marking the end of initial development and readiness for beta testing, signaling a major progress point.
What are the benefits of a milestone chart?
Milestone charts simplify tracking by focusing on key events, enhance stakeholder communication, identify potential delays, and motivate teams by celebrating major achievements.
Why are bar charts better?
Bar charts are ideal for comparing data across categories, providing a clear visual representation of numerical values, and showing trends and changes over time effectively.
What is a milestone and examples?
A milestone is a significant point in a project timeline, like “Project Kickoff” or “Product Launch,” marking major achievements and aiding progress tracking.
Which example is the best example of a developmental milestone?
A child learning to walk is a key developmental milestone, reflecting progress in physical development and marking a transition from crawling to walking.
What is the difference between a linked bar chart and a milestone chart?
A linked bar chart shows task relationships and durations, while a milestone chart highlights key events and achievements, focusing on critical points rather than task details.
How do you use a milestone chart?
Identify key events or achievements, list them chronologically, plot them on a timeline, and use the chart to track progress and ensure timely completion of milestones.
Why is it called a bar chart?
It’s called a bar chart because it uses rectangular bars to represent data, with each bar’s length indicating the value it represents, simplifying data comparison.
Which of these is an example of a milestone in a software development project?
“Completion of Code Review” is a milestone, marking the approval of code and allowing progression to the next phase, such as testing or deployment.
What are the disadvantages of a milestone chart?
Milestone charts may oversimplify complex projects, lack detailed task information, and become cluttered with too many milestones, reducing clarity.
When would a milestone chart be used instead of a bar chart?
A milestone chart is preferred for tracking significant events or achievements in high-level project planning and reporting, where key deadlines are more critical than task durations.
What is the purpose of a milestone plan?
A milestone plan outlines and tracks significant events in a project, ensuring goals are met, facilitating stakeholder communication, and identifying potential issues early.
Why are milestones useful?
Milestones track progress, ensure accountability, and motivate teams by marking significant achievements and providing clear progress updates.
What are bar charts most effectively used?
Bar charts are most effective for comparing data across categories, showing changes over time, and presenting numerical information clearly.
What is an example of a milestone analysis?
Reviewing milestone completion status in a project meeting, such as checking if “Beta Version Release” was achieved on schedule, to identify delays and discuss corrective actions.
What is an example of a milestone achievement?
“Completion of 100th Product Sale” is a milestone achievement, marking a significant success and progress point for a company or team.
What are the 4 types of milestones?
The four types are: Start milestones (beginning of a project), Intermediate milestones (key events within the project), End milestones (completion of phases), and External milestones (external approvals or events).
What is an example of a milestone in life?
“Graduating from College” is a life milestone, marking the end of an educational journey and the start of a new phase in life.
What are the three types of milestones?
The three types are Project Milestones (key project events), Personal Milestones (significant life events), and Career Milestones (important professional achievements).
What is an example of a milestone in marketing?
“Launch of New Advertising Campaign” is a marketing milestone, marking the start of a new effort to promote a product or service.
What is an example of a developmental milestone?
A toddler speaking their first words is a developmental milestone, indicating progress in language skills and cognitive development.
What is goals and milestone example?
A company aiming to increase sales by 20% within a year (goal) and setting quarterly sales targets (milestones) to track progress.
Which is an example of a social milestone?
A child learning to share toys represents a social milestone, indicating development in social skills and positive peer interactions.
What are the advantages of a milestone chart over a bar chart?
Milestone charts highlight key events, simplify project tracking, enhance communication, and motivate teams by focusing on major achievements.
What is the milestone chart used for?
A milestone chart tracks and visualizes significant project events, helping ensure timely completion of key phases and effective stakeholder communication.
When would a milestone chart be used instead of a bar chart?
Milestone charts are used for high-level project planning, reporting key achievements, and risk analysis, focusing on critical events rather than task durations.
What is an example of a milestone in a Gantt chart?
“Completion of User Testing” in a Gantt chart marks the end of the testing phase, signaling readiness for subsequent phases like final adjustments.
What is an example of a milestone in a business plan?
“Securing First Round of Funding” is a business plan milestone, representing a crucial achievement that enables further development and expansion.
What is the use of a milestone?
Milestones track progress, mark significant achievements, ensure timely completion of critical phases, and provide clear updates to stakeholders.
Why bar charts are better?
Bar charts are better for comparing and visualizing data across categories, showing trends, and illustrating numerical differences clearly.
What is a bar graph with an example?
A bar graph represents data using rectangular bars. For example, it could show monthly sales figures for different product categories, with each bar representing a category’s sales.
How to explain a bar chart?
Explain a bar chart by describing the categories on the x-axis and values on the y-axis. Point out bar lengths to indicate values and discuss comparisons between bars to highlight trends or differences.
How to create a milestone chart?
Create a milestone chart by listing key events in chronological order, plotting them on a timeline, marking each with a symbol or label, and using it to track progress.
Why are milestones important?
Milestones are important for tracking progress, ensuring accountability, motivating teams, and providing clear updates on the completion of key project phases.
What does “milestone” mean?
A milestone is a specific point in a project timeline representing significant achievements or critical phases, helping track progress and mark key stages.
What is an example of a milestone?
An example of a milestone is “First Product Prototype Completed,” indicating progress and readiness for the next stages of testing and refinement.
What is an example of a milestone in a contract?
“Delivery of Initial Design Drafts” in a contract is a milestone, signifying the receipt of drafts and often triggering payment or approval processes.
What is an example of project milestones vs deliverables?
In software development, “Completion of Feature A Development” (milestone) indicates progress, while “Delivering the Final Software Package” (deliverable) is the tangible output of the project.
What are the benefits of a milestone chart?
Milestone charts benefit project tracking by focusing on key events, enhancing stakeholder communication, identifying delays, and motivating teams with celebrated achievements.
What are the main disadvantages of bar charts?
Bar charts can become cluttered with many data points, may not show relationships or complex patterns well, and can oversimplify data.
What is a milestone bar chart?
A milestone bar chart combines bars showing task durations with milestone markers for significant events, providing a comprehensive view of task timelines and key achievements.
What is the difference between a linked bar chart and a milestone chart?
Linked bar charts focus on task relationships and durations, while milestone charts highlight key events and achievements, emphasizing significant project points rather than task details.
What is the purpose of using milestones in a Gantt chart?
Milestones in a Gantt chart highlight key events and phases, tracking progress, marking critical deadlines, and aiding stakeholder communication by showing major achievements.
What are the benefits of a milestone schedule?
Milestone schedules provide clear timelines, enhance stakeholder communication, enable early issue identification, and motivate teams by marking significant achievements.
What is the purpose of a milestone?
Milestones mark significant project events or achievements, helping track progress, ensure timely completion, and communicate key stages to stakeholders.
What are examples of developmental milestones?
Examples include a baby rolling over, a toddler walking, a child speaking first words, and a teenager graduating high school, indicating progress in physical, cognitive, and social development.
What is bar chart class 9 with an example?
A bar chart in class 9 mathematics uses bars to represent data values. For example, a bar chart could show the number of students in each grade level, with bar height representing student numbers.
How do you explain a bar graph in a presentation example?
Introduce data categories on the x-axis and values on the y-axis, point out bar lengths or heights, discuss comparisons to highlight trends, and explain any insights drawn from the graph.
What are the benefits advantages of bar chart technique for project planning?
Bar charts provide clear task duration visuals, facilitate comparisons, identify schedule conflicts, and aid communication by showing project timelines effectively.
What is a real-life example of a bar graph?
A real-life example of a bar graph is a supermarket’s monthly sales report by product category, where each bar represents a category like dairy or vegetables, and the bar height shows total sales, helping with business analysis.
What are the main disadvantages of bar charts?
Bar charts can become cluttered with many categories, may not effectively show complex data relationships, and can oversimplify information, leading to loss of detailed insights.
How to explain a bar chart in a presentation?
Explain a bar chart by describing the categories on the x-axis and the numerical values on the y-axis. Point out bar lengths or heights to indicate values, discuss comparisons, and highlight trends or differences in the data.